Category: Product

  • Time to Write a Spec

    What one schema misunderstanding taught me about AI and product management

    A co-worker reached out to me this week, asking for help explaining the relationship between two attributes.

    Our understanding was product_type is how the content is available and stream_type is how it was consumed.

    I knew this was wrong, but it was so plausible that I started wondering if I was wrong about it being wrong. So I did what everyone does now: I asked Claude.

    Claude replied:

    product_type = the product experience,
    stream_type = the technical stream shape.
    They correlate but are not a clean parent/child hierarchy

    It wasn’t the same words, but it felt strikingly similar to what my colleague had shared.

    Was my colleague inferring this relationship with the help of AI? I think so. Just to be sure, I asked chatgpt if both statements were similar.

    The (abbreviated) answer:

    I think the AI answer is better than the human answer. But they converged on essentially the same abstraction

    Chatgpt went on to praise the AI for reverse-engineering the schema from the data.

    An alarm bell rang in my head.

    I knew it was time to write a spec.

    Claude got it wrong. Chatgpt got it wrong. Whichever LLM my colleague used–if they had even used one–got it wrong.

    Claude didn’t hallucinate here. It did what engineers do every day: looked at the evidence and built the simplest model that explained it.

    It wasn’t the reasoning, it was the lack of evidence. Two critical pieces were missing: formulas and history.

    First, the apparent relationship between productType and streamType is a matter of mutability and aggregation function. ProductType is immutable in a playback session: it’s set at the start and never changes. When we transform hundreds of events into a playback session, the first non-null value wins. StreamType is mutable in a playback session. Ever stream a sporting event, and after the post-game wrap-up the game is rebroadcast from the beginning? The streamType will change from 'event' to 'eventReplay' at that point. When we create a playback session, the most frequent streamType across all the events wins.

    Second, we’d been trying to deprecate this attribute for years, but couldn’t because it shows up as a slicer in so many executive reports.

    That’s the spec I wrote: having streamType determine product_type so the Disney+ player can drop productType completely without breaking anything downstream.

    Fixing productType solves one small, immediate problem. It doesn’t solve the problem that created it. It’s not that Claude can reason better with context. That’s obvious. The interesting question is how you make that context available at exactly the moment someone needs it.

    The real challenge is the same it’s always been for a product manager: how do you get users to adopt your product?

    I’ll have some more detailed posts about how I think my users at Disney will consume context and what product capabilities I’ll need to meet them where they are, but here’s a hint from when I asked Claude:

    let’s connect to databricks and look at product_type and stream_type. what’s the difference?

    Here are the first three things Claude wrote in the pre-answer hourglass-ish stream-of-text that I rarely pay attention to:

    1. I’ll load the Databricks SQL tools and query the table to compare these two columns.
    2. Let me look at the two columns — their definitions and value distributions.
    3. Both are strings with no column comments. Let me pull their value distributions and how they overlap.

    Look at the third. Claude naturally looked for column comments before trying to infer meaning from the data. Putting context into comments on a table is one simple way to meet users where they are, and we’re not doing it.


    Here’s Claude on productType and streamType WITH context generated by a formula agent

    What I think the relationship is

    They’re two labels for the same underlying concept — “what kind of stream is this” — at two different resolutions, and they do NOT agree cleanly.

    My read on why they disagree (hypothesis — not grounded)
    The two columns are aggregated differently at the session level, and I think that’s the whole story:

    product_type = first(product_type) → grabs the first heartbeat’s value.
    stream_type = mode(streamType) → grabs the most common value across the session.

    A session’s heartbeats can carry different metadata over its life (e.g., a live channel that starts from a VOD-style pre-roll or start-over buffer, then settles into linear). first() and mode() will legitimately land on different answers for the same session — and first() is far more fragile because it’s hostage to whatever heartbeat happened to arrive first. That’s consistent with stream_type being the “settled” truth and product_type being noisy.

    I want to be explicit that this is a hypothesis about mechanism, not something the canon documents. The data shows the disagreement; it does not tell me why a given linear session got stamped VOD. I’d flag that as a context gap rather than assert it.

    Look at that last paragraph. Canon? That’s a future post. Flagging as a context gap? That’s a future post as well.

    Claude didn’t just do that. All of that product behavior is intentional.
  • Real-world big data – Preso for a UC Berkeley course about big data

    This is my final presentation for UC Berkeley Extension’s Intro to Big Data course. It contains my perspective on the things that a data analyst, data scientist or data engineer will experience and need to watch out for navigating the data sprawl of a massive big-data environment.

  • Kickstarting a data-driven culture: Same meeting, many conversations

    Kickstarting a data-driven culture: Same meeting, many conversations

    I’m Mike O’Neill and I’m a data nerd who uses Azure Data Explorer, or Kusto, every day to glean insights into Azure’s developer and code-to-customers operations.

    I’ve worked in data-driven organizations for most of the last decade plus, so it’s been a bit of a culture shock to work in an organization that doesn’t have data and analytics in its DNA.

    I knew coming in that my team in Azure didn’t have the foundation of a data-driven culture: a single source of truth for their business. That was my job, but I naively expected this to be purely a technical challenge, of bringing together dozens of different data sources form a new data lake.

    I learned very quickly that people are the bigger challenge. About a year into the role, my engineering and program management Directors both hired two principal resources to lead the data team. I was excited, but the three of us were constantly talking past each other, and now I think I know why.

    I was working to build a single source of truth so that many people, including our team, could deliver data insights, but those new resources focused on us delivering data insights.

    The difference is subtle, I realize, but it’s a big deal: if we only deliver data insights, we’ll end up as consultants, delivering reports to various teams on what they need. That’s work for hire, and it doesn’t scale.

    If we build a single source of truth, those various teams will be able to self-serve and build the reports that matter to them. Democratizing data like that is a key attribute of a data-driven culture.

    So why were the three of us talking past each other when we were talking about same business problems? I think it was a matter of perspective and experience.

    To oversimplify the data space, I think there are four main people functions, and the experience learned from each function guides how people view the space. Our v-team had people from all of those spaces, and the assumptions we brought to the conversation were why we were speaking past each other.

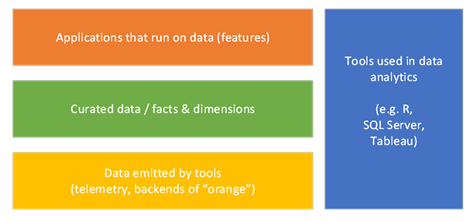
    First is this orange box, which is about doing, well, useful stuff with data. This is what everybody wants. This is where data scientists and analysts make their money.

    The risk with this box is an overfocus on single-purpose business value. It’s great to have a useful report, but people who live only in this box don’t focus re-usable assets. Worst case scenario, it’s work-for-hire, where you shop your services from team to team to justify your existence.

    Second is this yellow box, which represents telemetry. I’m using that word far more broadly than the dictionary defines it: to me, it’s the data exhaust of any computer system. But that exhaust is specific to its function and consumption is typically designed only for the engineers that built it.

    The risk here is around resistance to data democratization. If you’re accustomed to no one accessing the data from your system, you won’t invest the time to make it understandable by others. When you do share the data, those new users can drown you in questions. Do that a few times, and you learn to tightly control sharing, perhaps building narrowly scoped, single-purpose API calls for each scenario.

    Third, you need tools to make sense of the data: this is the blue box in my diagram. There’s a bajillion dollars in this space, ranging from visualization tools such as PowerBI and Tableau, to data platforms such as Azure Data Lake, AWS Redshift and Oracle Database. The people in this space market products to the people in my orange box, whether it’s data scientists or UI designers.

    The risk in the blue box is in the difference between providing a feature relevant to data and delivering data as a feature. It’s easy to approach gap analysis by talking to teams about what data their services emit and taking at face value their assessment of what their data describes.

    If you are in the data warehouse space, however, a gap analysis is about the data itself, not in the tools used to analyze that data. Data gaps tend to be much more ephemeral than gaps in data product features, especially when you are evaluating a brand-new data source. In my experience, a conversation is just a starting point. You can trust, but you need to verify by digging deeply into the data.

    And that brings me to the green box. In current terminology, that’s a data lake, and it’s where I’ve lived for the past decade. The green box is all about using tools from the blue box to normalize and democratize data from a plethora of telemetry sources from the yellow box, such that people in the orange box can do their jobs more easily. It’s about having a single source of truth that just about anyone can access, and that’s one of the foundations of a data-driven culture.

    So what’s the risk in the green box? I like to say that data engineers spend 90% of their time on 1% of the data. Picking that 1% is not easy, and perfecting data can be a huge waste of money. Data engineering teams are very, very good at cleaning up data, and they are also very, very good at ignoring the law of diminishing returns. But they are not very good at identifying moral hazards, at forcing upstream telemetry sources to clean up their act.